Cost Per Graduate: The Number NZ VET CEOs Are Missing
28 July 2026 · 8 min read

Cost-per-enrolment is the number on most board packs. It's also the wrong one to be steering by. With domestic fees capped at 6% for 2026 and TEC funding only 99% of forecast volume, the figure that actually decides your margin, your NZQA standing and your board's confidence is cost per graduate who demonstrably reaches competency — and it's rising quietly while almost nobody is tracking it.
Why this lands on your desk
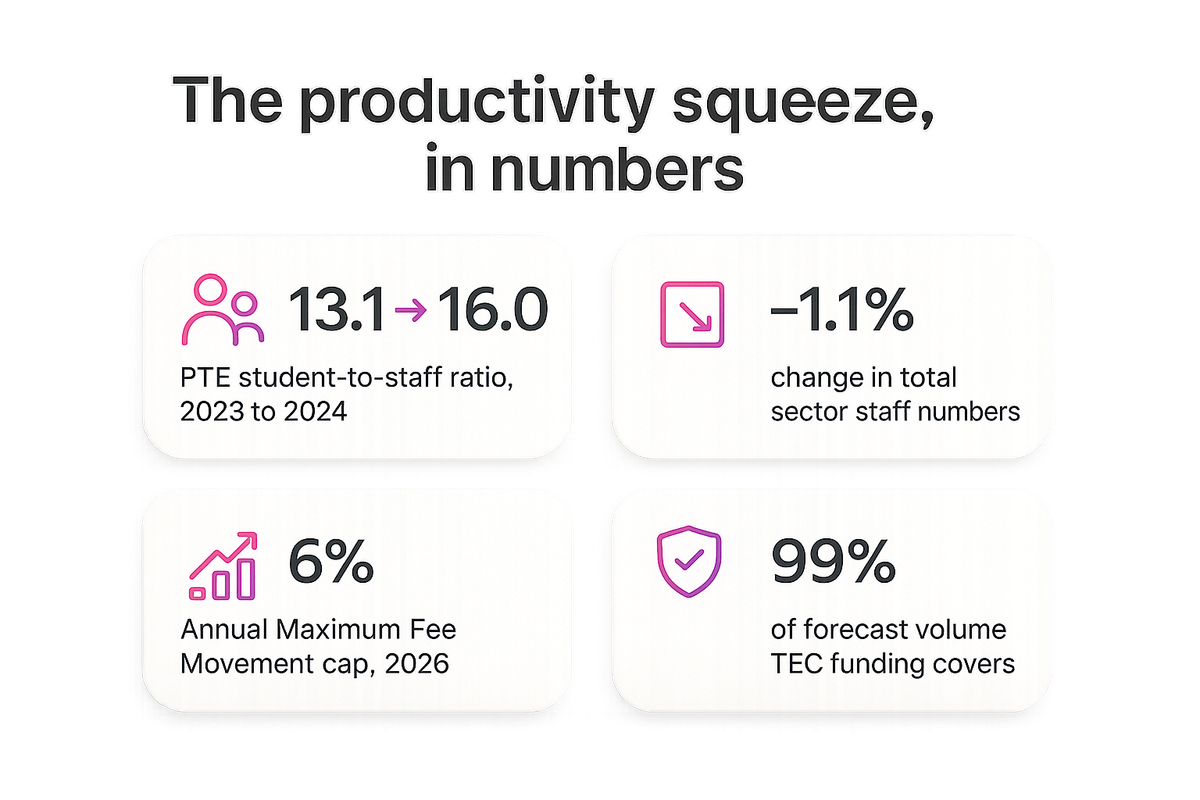
You can't grow your way out of this one on price. The Minister has confirmed the Annual Maximum Fee Movement at 6% for 2026, which caps how far you can lift domestic fees to cover rising delivery costs. On top of that, TEC's funding for volume is set to cover only 99% of total forecast volume across 2025 and 2026 — meaning roughly one in a hundred forecast students effectively goes unfunded. RNZ reported in February 2024 that TEC does not have sufficient funding to meet forecast demand from 2026 onward, and that a gap between tuition subsidies and inflation has been widening since 2020. That gap predates the current fee settings and compounds them.
Put simply: revenue per student is capped from both directions. If margin has to come from somewhere, it has to come from cost. And the cost that matters isn't what you spend to enrol someone — it's what you spend to get them, verifiably, to competency.
Cost per enrolment vs cost per graduate
Cost per enrolment tells you how efficiently you fill seats. It says nothing about what happens after enrolment — whether a learner actually completes, whether they demonstrate the unit standards or qualification outcomes required, or whether your delivery model can sustain that outcome as class sizes grow.
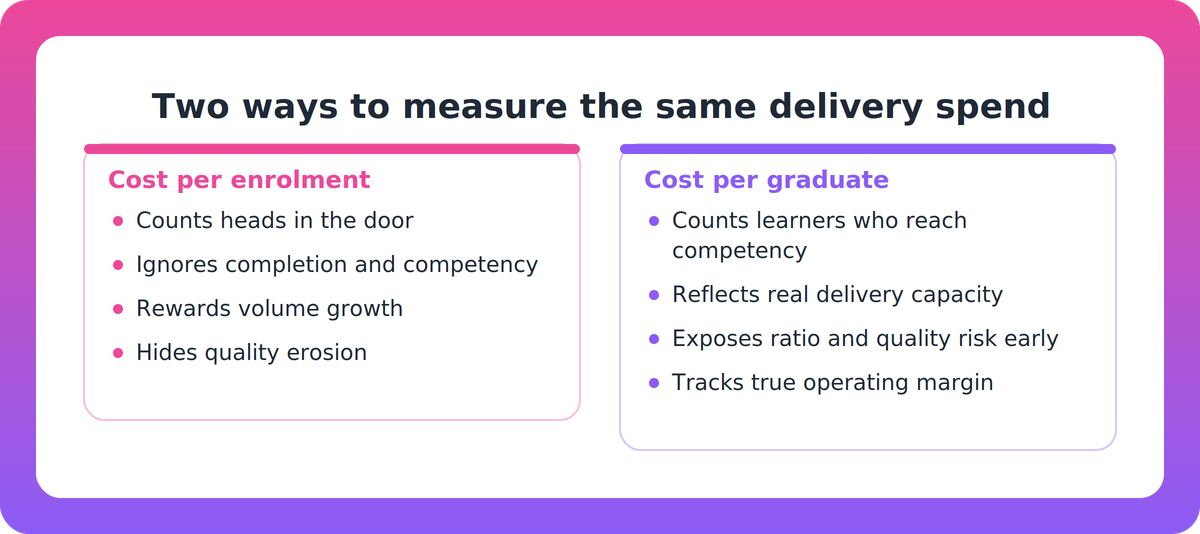
Cost per graduate — total delivery cost divided by learners who genuinely reach competency — is the number that tracks real margin. It also happens to be the number NZQA's External Evaluation and Review (EER) process is quietly testing for, because EER looks at outcomes and educational performance, not enrolment volume. A provider can look financially healthy on cost-per-enrolment while its cost-per-graduate is climbing fast enough to put the next EER rating at risk.
The ratio squeeze: doing more with less, quietly
Here's where it shows up first. Student-to-staff ratios at Private Training Establishments rose from 13.1 to 16.0 between 2023 and 2024 — a jump in a single year — while total sector staff numbers fell 1.1% overall, according to NZ Herald reporting on tertiary staffing. That combination is a productivity squeeze with two faces: it raises the real cost of producing a competent graduate (each staff member is now stretched across more learners), and it raises regulatory exposure at the same time, because delivery capacity per learner is exactly what an EER panel is probing when it asks how you assure quality at scale.
Under NZQA's monitoring framework, a Category 3 or 4 rating automatically triggers a required improvement plan, and NZQA can conduct unannounced compliance visits. If your ratios have moved and you can't show how delivery capacity — coaching time, assessment turnaround, individual feedback — has held up, that's the conversation an EER reviewer will have with you, not a hypothetical one.
Restructuring is cutting heads — the question is whether it's cutting the right cost
The sector is already responding, but mostly through headcount. Toi Ohomai Institute of Technology has proposed disestablishing 166.7 FTE roles. Whitireia and WelTec closed the Te Auaha creative campus, cutting 48 jobs. These are real, visible cost reductions — but headcount cuts only improve cost-per-graduate if the roles removed weren't part of what actually gets learners to competency. Cut the wrong layer and you've lowered cost-per-enrolment while quietly raising cost-per-graduate, because fewer people are now producing the same completion and competency outcomes with less coaching capacity per learner.
International student economics make the stakes sharper for polytechnics specifically. Sector reporting cited in recent briefings puts the profit differential per international versus domestic student at around $11,900 for universities but only about $2,300 for polytechnics — polytechnics have far less room to use international margin to prop up domestic delivery quality while they restructure.
Te Pūkenga's disestablishment changes the competitive map
From 1 January 2026, legislation passed in October 2025 disestablishes Te Pūkenga, creating ten regional polytechnics and a transitional entity, alongside Industry Skills Boards taking on parts of the qualifications and standards-setting role. Officials have explicitly flagged that financial viability risk, management capability and educational quality risk remain elevated across several of the new entities during transition, per Ministry of Education and Newsroom reporting.
For a PTE or ITP GM, this reshuffles where students, funding and staff might move over the next two years. It also means some competitors will be distracted rebuilding back-office and governance capability rather than investing in delivery — a window, but only if your own cost-per-graduate is under control while theirs isn't.
Where the real lever sits
Across the EER reports and sector cases reviewed for this piece, the pattern holds: providers under audit or financial pressure that protect delivery capacity — coached practice time, assessment feedback loops, individual learner support — tend to hold their cost-per-graduate steady even as ratios rise elsewhere in the sector. Providers that cut delivery capacity to protect enrolment-side cost tend to see it show up later, in completion rates and EER findings.
That's the decision in front of you this quarter: not headcount versus cost, but which costs are actually producing competent graduates versus which are just producing enrolments.
Key takeaways
- Domestic revenue per student is effectively capped by the 6% AMFM for 2026 and TEC funding only covering 99% of forecast volume — margin has to come from cost, not price.
- Cost per enrolment measures how well you fill seats; cost per graduate measures how well you convert delivery spend into demonstrated competency — and only the second one tracks real margin and audit risk.
- PTE student-to-staff ratios rose from 13.1 to 16.0 in a year while sector staff fell 1.1%, a productivity squeeze that raises cost-per-graduate quietly, before it shows up in EER findings.
- NZQA can issue a required improvement plan on a Category 3 or 4 EER rating and conduct unannounced compliance visits — delivery capacity is a live regulatory exposure, not just a reputation issue.
- Te Pūkenga's disestablishment into ten regional polytechnics from January 2026 is reshuffling the competitive field, but officials have flagged financial viability and quality risk across several of the new entities.
Our take
Boards love cost-per-enrolment because it's easy to graph and it moves in the direction everyone wants. Cost-per-graduate is harder to calculate and less flattering in the short term, which is exactly why it gets ignored until an EER visit forces the question. Our view: any provider restructuring in response to the fee cap or the funding gap should model cost-per-graduate before touching headcount, not after. Cutting the wrong 10% can look like savings on a P&L and look like a Category 3 finding twelve months later. Some providers are already testing whether AI-generated coached practice and simulation can lift delivery capacity per staff member without lifting headcount — that's worth watching closely over the next year, though it's not yet proven at sector scale in New Zealand.
The honest starting point isn't a new system. It's asking your leadership team a blunt question this quarter: for every dollar we spend on delivery, how much of it is actually reaching a graduate who can demonstrate competency — and how would we know if that number moved?
FAQ
What does "cost per graduate" mean, and how is it different from cost per enrolment or cost per EFTS? Cost per enrolment (or per EFTS) divides delivery cost by the number of students enrolled, regardless of outcome. Cost per graduate divides the same cost by the number of learners who actually demonstrate competency and complete — it's the number that reflects real delivery capacity and margin, and the one closest to what NZQA's EER process is assessing.
How does the 2026 Annual Maximum Fee Movement affect provider margins? The Minister has confirmed the AMFM at 6% for 2026, capping how much providers can raise domestic tuition fees. Combined with TEC funding covering only 99% of forecast volume for 2025 and 2026, revenue per student is largely fixed — margin improvement has to come from managing delivery cost, not raising price.
Why do rising student-to-staff ratios matter for NZQA audit risk? PTE student-to-staff ratios rose from 13.1 to 16.0 between 2023 and 2024 while overall sector staffing fell 1.1%. NZQA's EER process examines delivery and outcomes, and a Category 3 or 4 rating triggers a required improvement plan plus the possibility of unannounced compliance visits — so a ratio shift that erodes delivery capacity is a direct audit exposure, not just a staffing metric.
What does Te Pūkenga's disestablishment mean for competitive positioning from 2026? Legislation passed in October 2025 disestablishes Te Pūkenga from 1 January 2026, replacing it with ten regional polytechnics/entities and a transitional NZIST, alongside Industry Skills Boards taking on qualification-related functions. Officials have flagged elevated financial viability, management capability and educational quality risk across several new entities during the transition, which reshapes where students and funding may move across the sector.